
ISB in Antarctica: Give Us the Water!
 isbscience.org/news/2013/04/02/isb-in-antarctica-give-us-the-water/
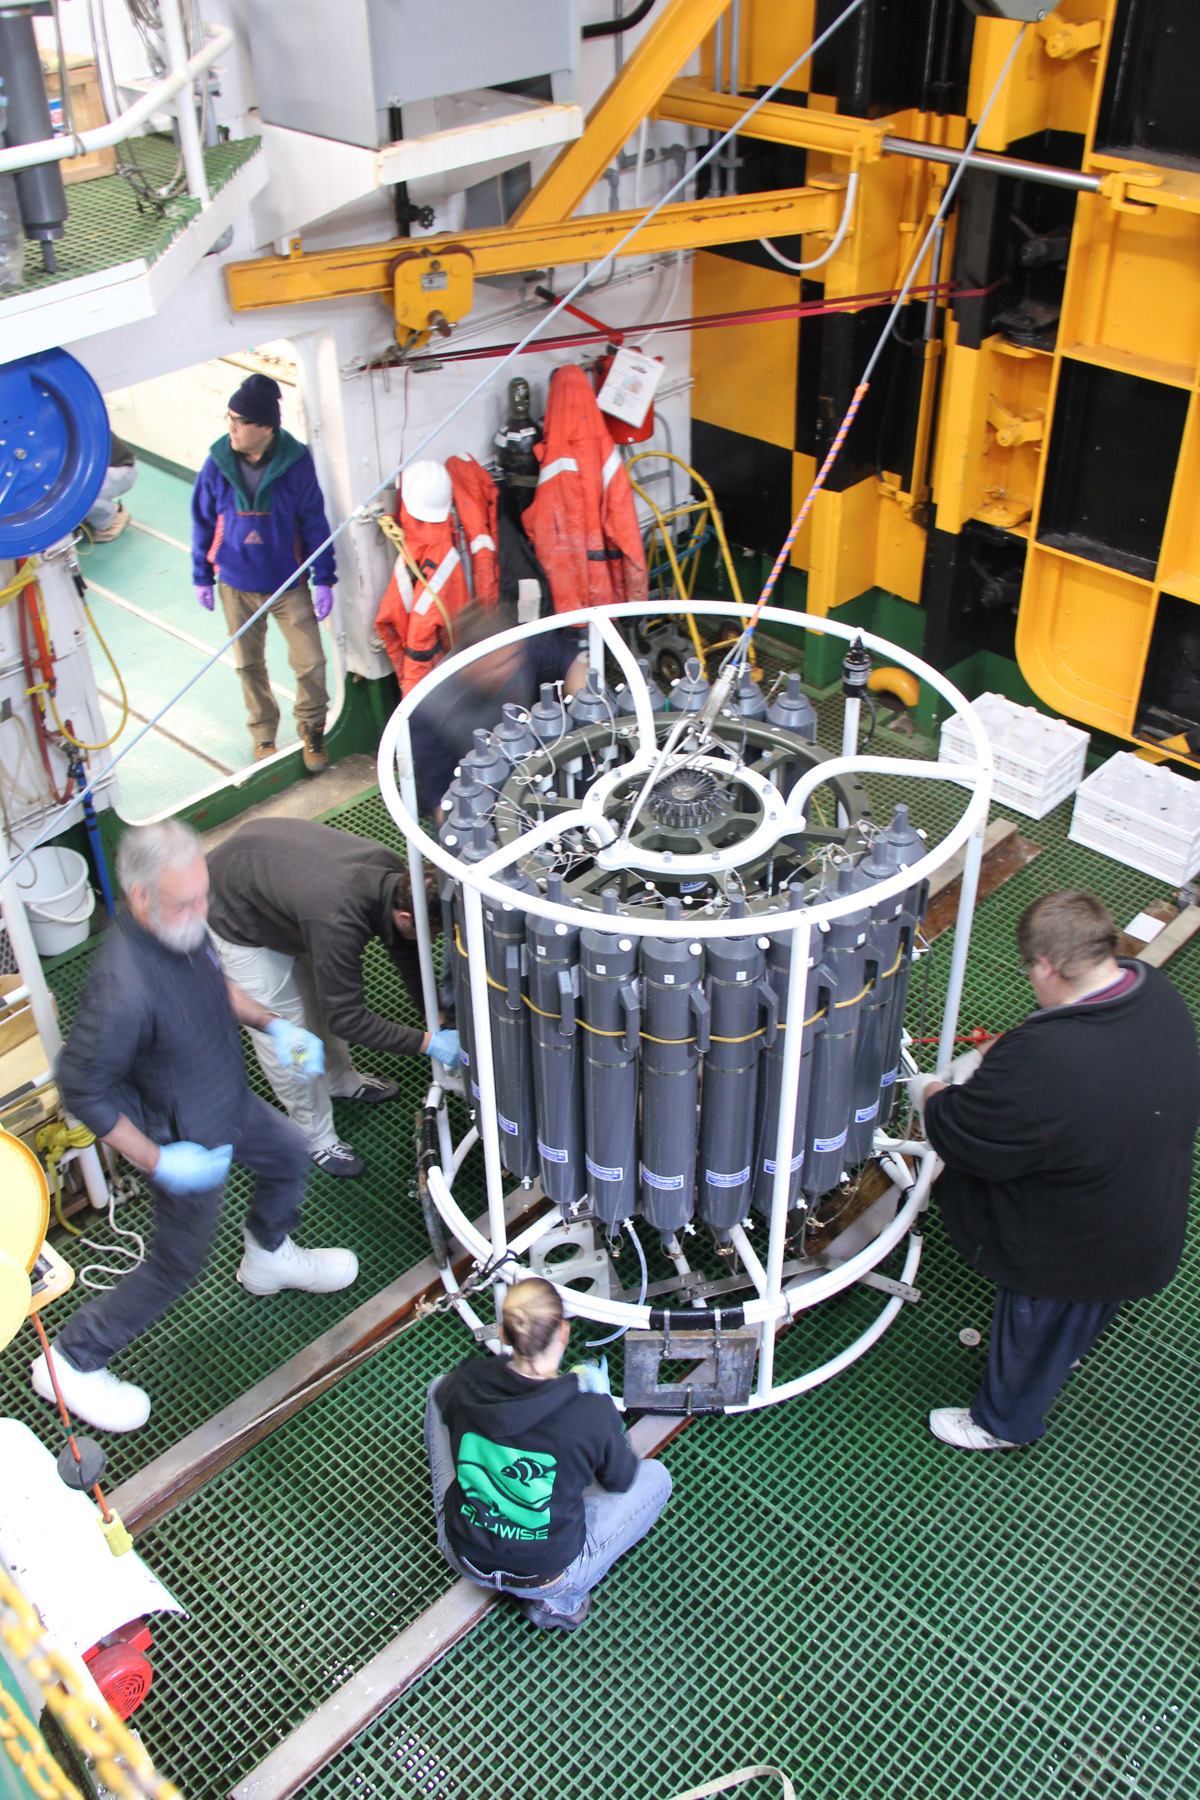
By Allison Lee, ISB Research Associate
Just how much water is there to be had in the Ross Sea? There are approximately 265,000,000,000,000,000 liters*. Did that number go in one eye and out the other? It did for me. Let’s just say that’s a lot of water and scientists want to know about all of it—where it came from, where it’s going, the chemistry, the biology, temperature, salinity, floating particles, and so forth.
There are two issues I’d like to explain to you:
- Where do you decide to collect this water?
- How do you collect it?
Where oh Where?!
Obviously we can’t take ALL of the water in the world and measure its properties. We can, however, do our best to characterize as much of it as possible. In fact, all over the world, cruises like the one we are on are out collecting information about the oceans. Using software, like Ocean Data View, scientists can have a pretty good idea of what is going on. All of these blue dots are locations where water was analyzed.
A map that Allison made using the GLODAP dataset with the program Ocean Data View (ODV), which she learned how to use in a course Dennis is teaching us aboard the Palmer, entitled Marine Biogeochemistry.
This is a map of the Ross Sea, which displays locations where samples were collected during TRACERS. Map credit: A. Lee using ODV.
How do scientists even begin to know where to choose to take samples? Let’s explain this with an analogy we might all relate to:
If you know that your dog hid your favorite pair of slippers in the backyard and you wanted to find them, where would you look? Would you start in one corner of the yard and work your way to the other corner in rows? Probably not. You wouldn’t start your search aimlessly looking everywhere. That would take you all evening. You’d have some sort of plan and rule out certain areas first. You would look for dirt that seems to have been dug up, or under the dog’s favorite corner, or you may even look under the porch. If you knew your dog’s behavior well enough, then you might even know exactly where she’s hidden your slippers!
Scientists do the same thing with oceanography. We pore over charts and based on the knowledge of where water moves, how water moves, the topography of the ocean bottom (bathymetry) and the location of living organisms such as algae. Then scientists choose these certain “hotspots” and start there.
We have drawn a line that we would like to investigate. In the upper right corner is a photo of chlorophyll (or algae) from satellite data. Photo credit: A. Lee.
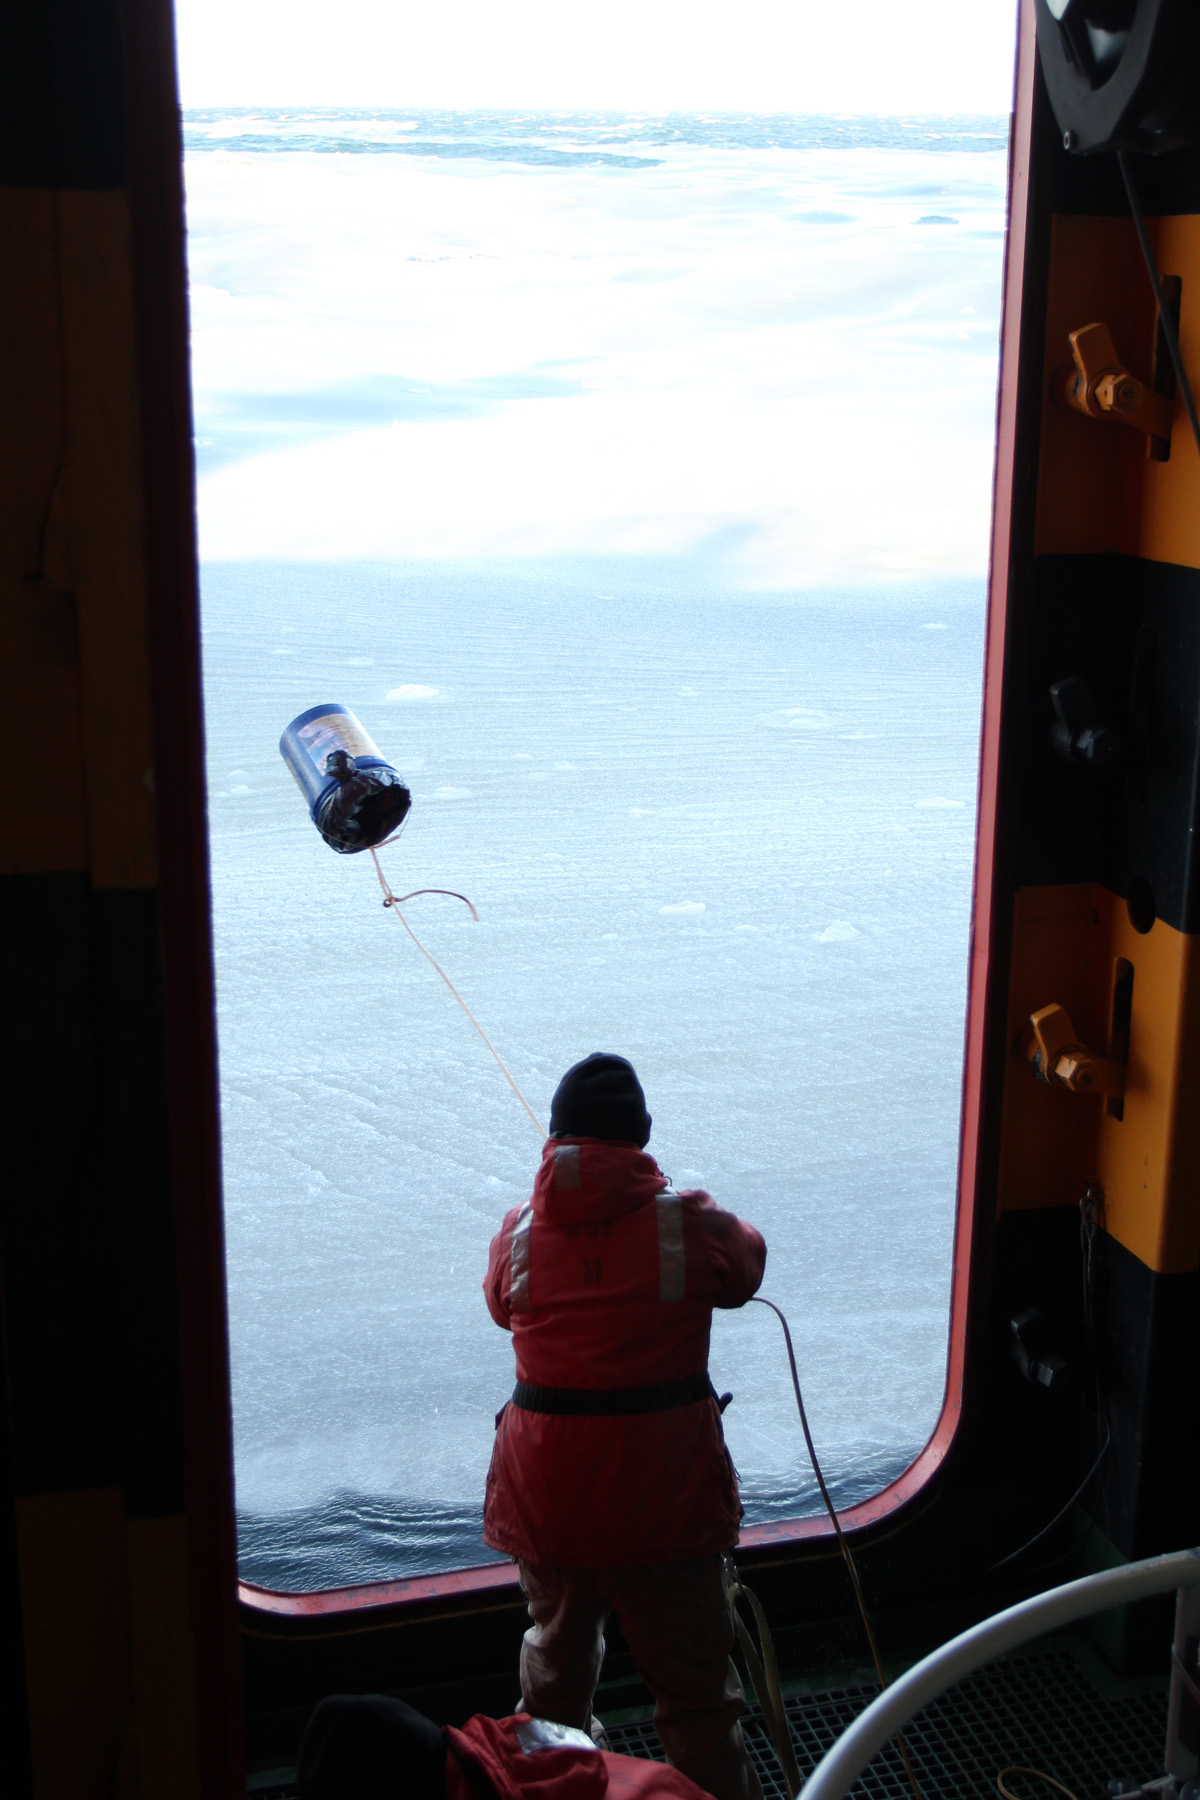 This is the old-school method: Tossing the Pail. When you need deeper depths you simply add more rocks or weight to the bottom of the bucket so it sinks. Photo credit: A. Margolin.
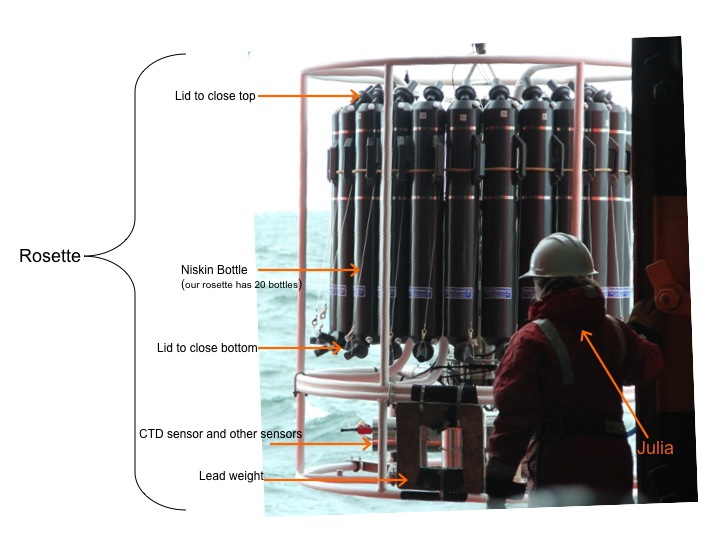
This is the CTD rosette that we use to sample the ocean. Photo credit: A. Lee.
The Niskin bottles hold 12 liters of water each and are arranged in a circle called a rosette. Commonly, we just refer to the entire thing as a CTD but technically, a CTD is the little package of sensors attached to the Rosette that measure Conductivity (Salinity), Temperature and Depth. The information about the salinity, temperature, and depth, as well as fluorescence of chlorophyll (algae) and oxygen levels are sent to the ship as we lower the CTD package to the bottom of the ocean.
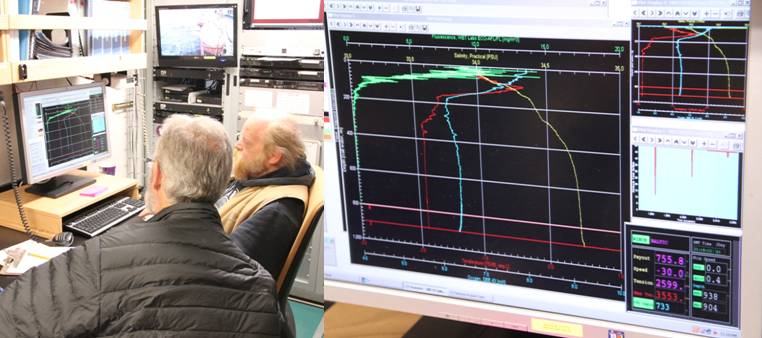
On the left, Rob and Kevin look at the CTD data as the rosette is lowered. On the right, the CTD data is displayed on the computer. Photo credits: A. Lee.
We can look on the screen as the profiles are being recorded and decide on what depths the bottles should close at as the CTD comes back up to the surface. Once the CTD reaches the bottom, one of the ET’s (either Sheldon or Kevin) will push a button to close Niskin bottles at the desired depth, collecting that water for us to analyze in our various laboratories on the Palmer.
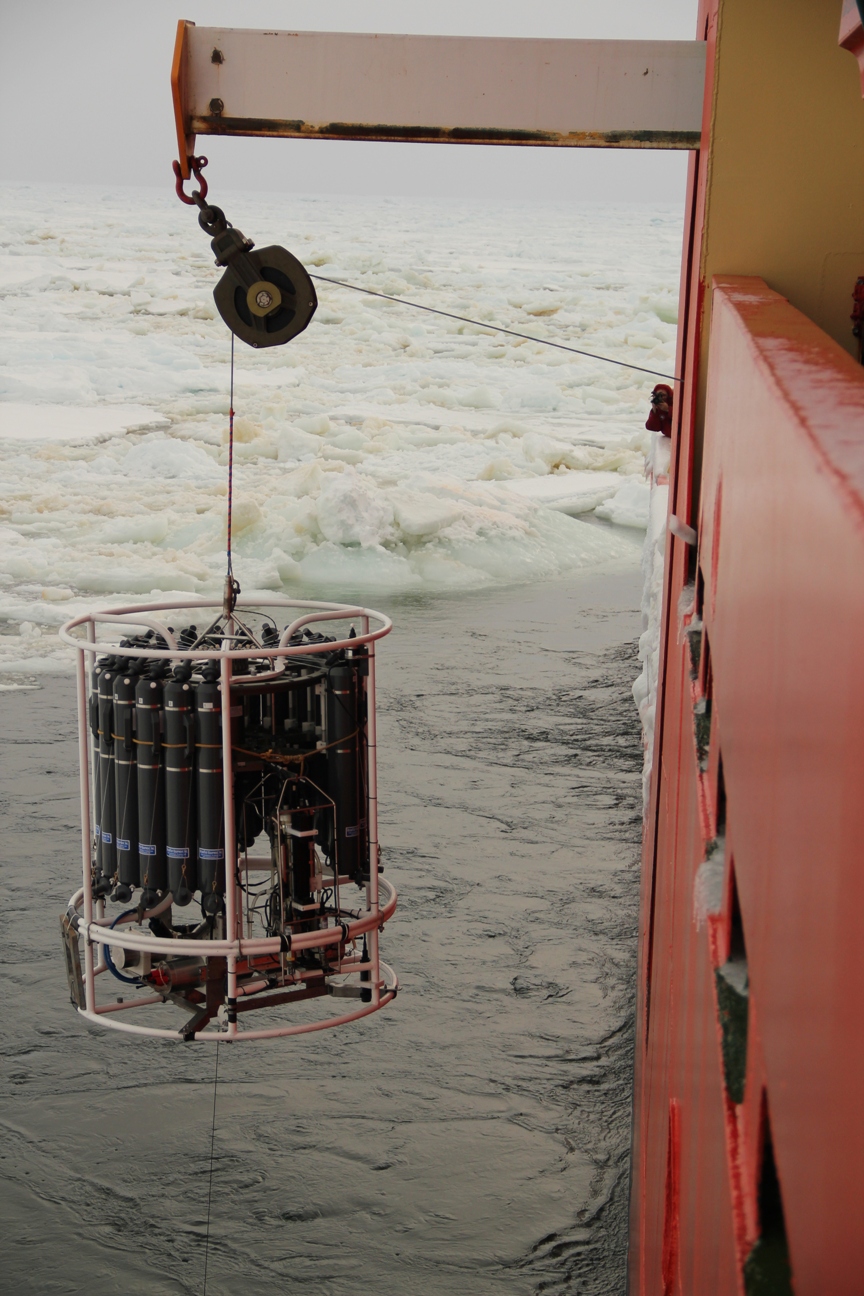
The CTD rosette being deployed. Photo credit: A. Lee.
Each time this “CTD” or “Rosette” goes in to the water it is called a “cast”. Over the past month we have taken 135 casts. We collect seawater about 4.5 times a day (in addition, each time it enters and exits the water we have to do 25 pushups). That doesn’t seem like a lot but considering we have to actually DO something with all the water once we collect it, time flies and it’s already time for the next cast.**
Now that the CTD is on deck, everyone wants the water from it. Before anyone can take the water, a “water budget” is created so there will be no fighting for who goes first. Before the cruise started, scientists sat down to discuss the volumes they needed based on the types of studies/analyses they intended to do. Those people collecting for gases go first because once the volume leaves the Niskin, air fills the top and can change the gas composition inside. Everyone goes in order and if you cut in line you get elbowed.

Santiago patiently waits just outside the Baltic room while (from left to right) Dave, Rob, Cassandra and Petey sample for gases. Photo credit: A. Lee.
Once everyone has taken their share of water, we each head back to the lab to begin our analysis or collection method to store it for later analysis.

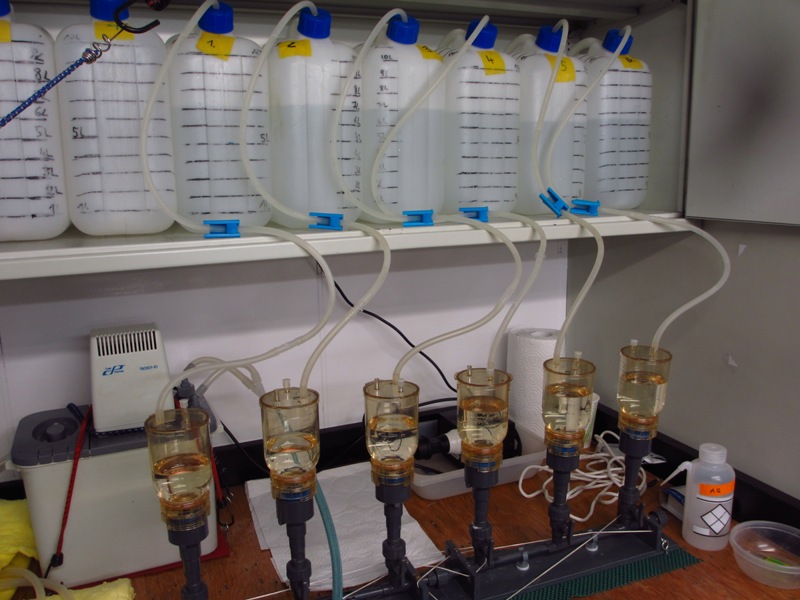
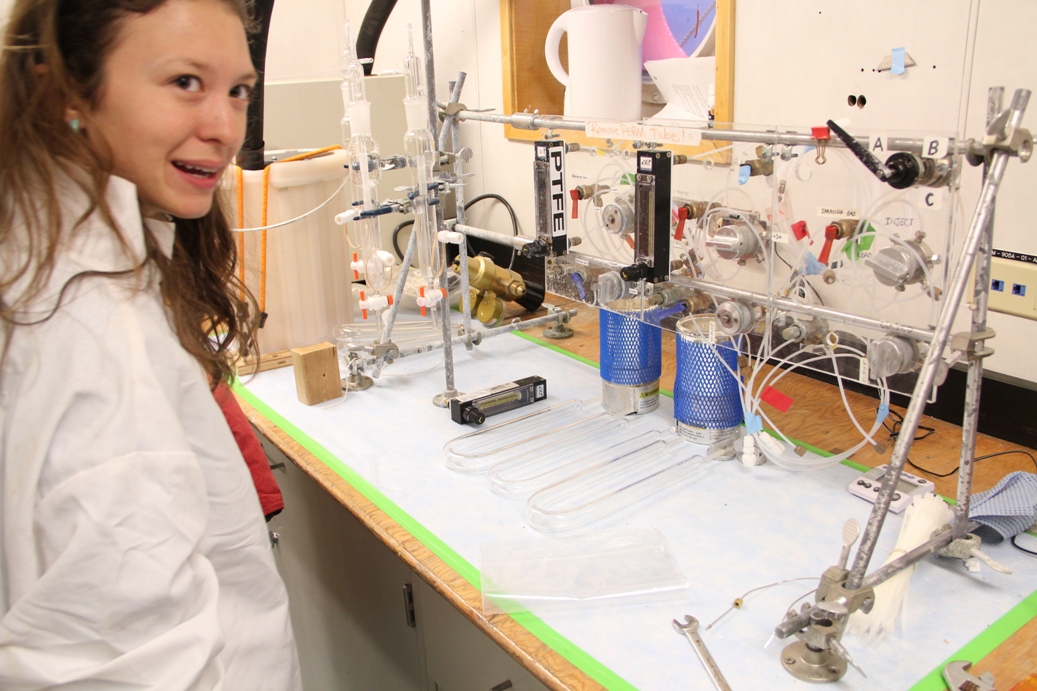
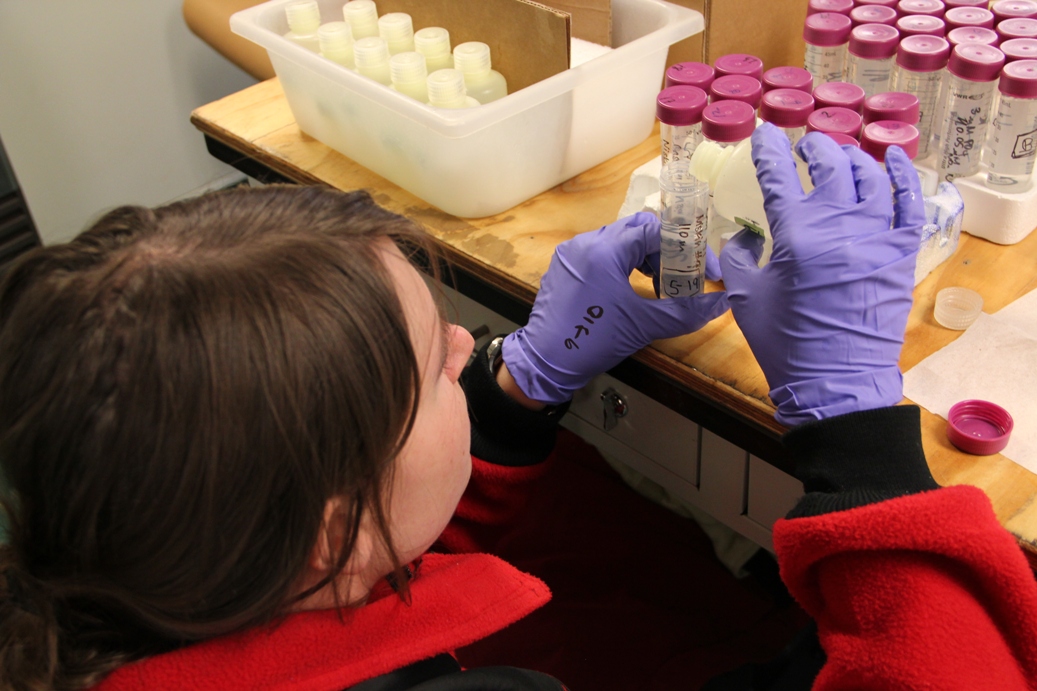
Dave taking a break from eating desserts to do some POC’ing, Roberta’s filtration setup for microbes, Rachel in the lab ready to analyze some phytoplankton, and Meredith preparing for nutrient analysis. Photo credits: A. Lee
Check out Cassandra’s new National Geographic post on TRACERS http://newswatch.nationalgeographic.com/2013/03/12/fighting-for-the-last-tomato-surviving-a-field-season-in-antarctica/
*Yes, I actually calculated that with the help of Kim Goetz and GIS software. The Ross Sea is a small blip on the map and water is circulating in and out constantly so there is no real fixed volume.
** Now that you know some terms I want to throw some more calculations at those of you who like to nerd-out. Just hold my hand and follow me: If our Rosette has 20 Niskin bottles that each hold 12 liters, then that is approximately 240 liters per cast that we can take. If we were to actually take all of the water in the Ross Sea averaging 4.5 casts a day it would take us ONLY 245,000,000,000,000 days or 672,000,000,000 years! So the moral of the story: thank goodness for software that helps analyze ocean data because there is no way to sample all of the water in the Ross Sea much less the entire global ocean!